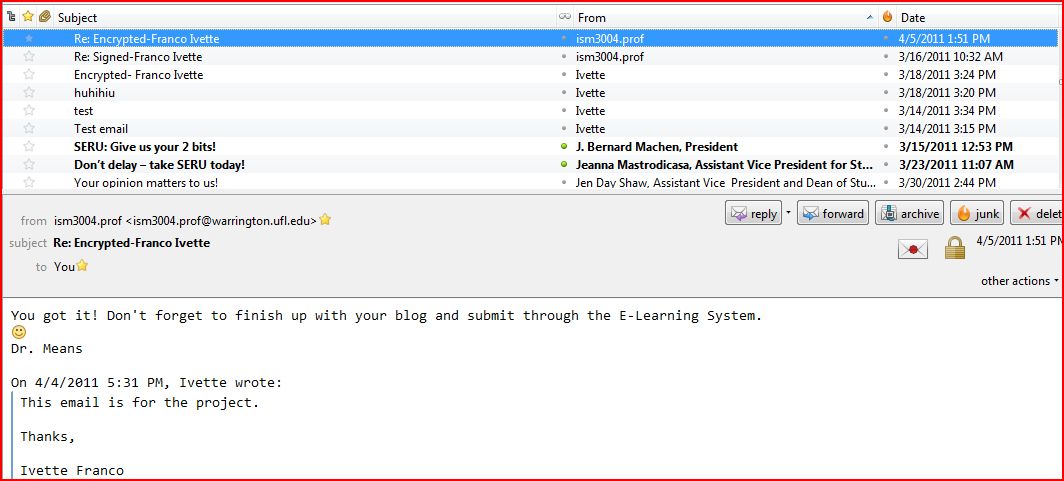
In our project Secure Email, we were asked to send a digitally signed and encrypted email. Once both emails were replied by Professor Means, we were ready to start our blog.
Please see below the screen capture of my Thunderbird inbox with both replies.
The main purpose of this project was to learn how to protect our emails that could contain sensitive data from other people other than the recipient. This is very important especially for business that share private information through emails.
In summary, the article discusses how Wells Fargo started using an easy way to have secured emails and its benefits. The vice president, Bipin Sahni, was concerned about his clients, and the security of the information that is sent online. The VP of the company emphasizes that users are not all tech savvy, thus Wells Fargo looked for encryption products, and found one very helpful.
Now having emails protected, Wells Fargo’s customers and employees send about 60,000 emails monthly. Besides, Wells Fargo saves a lot of money in sending documents containing confidential information via priority mail to customers, and not only that, but also time. Unquestionably, secure email plays an important role in many companies, and Wells Fargo is an example of this.
I would say this project has been one of the most difficult projects throughout the semester. I think I had complications working with access because this program is not very used like, Word, Excel, or PowerPoint, but it is definitely very helpful. As soon as I started working on the project, I had problems importing the table; every time I imported the table a message error came out. After several tries, I finally figured out what the problem was. I needed to change the type of the document to Excel 97-2003. See below to know what I am referring to.
Created by Ivette Franco
Once I was done with that part, I started working on the tables, queries, forms, and reports. These steps were a little bit more challengeable, but I was able to finish it.
Created by Ivette Franco
I learned how to add records to my table. Above, you see a table with 1002 records (users), after I added two records, one of those an “Individual” and the other one a “Family”
The query was harder than the table, especially step “2D” which took me a couple of days to figure it out. Definitely, I think is very necessary to have a prior experience on Access in order to be able to working without any kind of complications, but since it was not my case, it took a little longer to get it done.
Step 2D solved.
Created by Ivette Franco
Basically, I had to add another Last Name field, and sorted it in ascending order. In this case, I did not check marked it, as the first one. Then, under Left Date field I added a criteria written like this: >#9/27/2010#. This criteria would help to complete step 2D, and collect users that left the gym within the last 6 months only.
Once I was done with the first two sections, Table and Forms, everything is a little easier. After doing this project, I can tell I have an idea of to create a Table, Query, Form, and Record.
Microsoft Office Access is definitely a good program to collect and sort data. Access not only allows you to organize your data, but to import information saved in other applications.(see figure above)
Tips:
One way to enhance the functionality of this database in “forms” is, to get rid of properties that are unnecessary, and stay with the ones that are absolutely necessary to be set. We should review form’s startup code to ensure that we are not setting any control properties that don’t need to be set. We need to keep in mind that properties assignments are very expensive in terms of performance and effectiveness. We should also minimize the number of controls on our form, loading controls is the biggest performance hit.
This project, Web 2.0, has been one of the most frustrating ones in my entire life, starting from the storyboard to putting together the information, and uploading the video. I chose scenario 3, which was for non- profit organizations; St. Jude Children’s Hospital was my topic. I decided to use Windows Movie Maker instead of Power Point Presentation. I feel very comfortable working with both of them, but I felt that Windows Movie Maker would be more useful for this situation. WMM allows you customize almost everything according to your convenience. I have always liked working with pictures and stuff, but I need to confess that the hardest part was to collect all the information with logical flow into one video, but I think patient, besides my skills, was my main tool. I learned a lot by watching videos at youtube.com, specially the storyboard. To create my storyboard I used paint, and it was mission; but paint allowed me to organize and transmit my plan. I, then, had to change the order of slides, and add a couple of slides.
I believe people don’t like to see long presentations so I made it mine short, may be a little short, but, I think, it was good enough to persuade people to donate. Since my presentation was short I could not anticipate many questions; just two which have given sense to the whole presentation. I made these questions at the beginning of the presentation in order to grab audience’s attention, and, therefore, spark curiosity. I was trying to make a longer explanation with a little history of the St. Jude Children’s hospital, but, then, I realized that that wasn’t going to cause any effect in people’s mind and attitude towards donations. I also presented some statistics about people with cancer, and I think these numbers have done some kind of impact on people’s feelings because basically that is my goal (to make audience helping this organization, St. Jude). As I previously mentioned, my presentation was short which helped me to avoid clutter. Besides, I tried to be as organized as possible, clear, and concise. In order to make my presentation readable I just placed one picture per slide, and wrote some important words, most of the information was verbally expressed. Before submitting my presentation, I revised the spelling of every word in order to avoid any typo errors (I thought I did not have any typo, but someone noticed a typo, so I then revised it , and uploaded the video again)
As Professor Means says, sometimes the best way to learn is by teaching others; and seeing people’s mistakes helps you to see your own errors. Watching someone else’s presentations facilitate me to make some revisions on my project and give me new ideas. Sometimes, it is easier to perceive others mistakes than yours. Definitely, critiquing others’ work makes you learn more.
Working on this project, WEB 2.0, has helped to become a little more knowledgeable about computers. I believe I still need to learn a lot more, but, at least, I have an idea of how to start a presentation. Definitely, you need to be creative and have the correct tools such as, microphone, computer, etc. Nowadays, presentations are playing a very important role at school and at work as well. At work, you need to be more accurate and concise. A business person needs to be able to transmit their message in a clear way through a presentation; not all positions will require you to make a presentation, but some will.
This project was very interesting and challenging. It was about a fitness center, in where you were supposed to help the gym’s owner in researching the effectiveness of a particular workout. Your main tool was an Excel’s spreadsheet that had data for 500 subjects. The data basically contained age, sex, and 21 heart rate measurements for a period of 20 minutes (starting from time 0:00 to time 20:00). Once, that we had an idea of what the project was about, it was time to start formatting and manipulating the data. First, we were asked to name the spreadsheet “Raw Data” and make the first 2 rows bold, and center the gender column. So far, everything was pretty easy because it was basic stuff that we learn in middle school. But, when I was asked to use the “Freeze Panes” to lock the first 2 rows, I got stuck; this step required me to do a little bit of research to figure it out. I believe this feature is very useful, mostly when you want to print out balances, data, and so on. After I finished formatting the raw data, it was time for me to start working with formulas.
This part of the project made me recall when I was a middle school student. It was time to refresh my memory and start working on the formulas. The first formula was easy; we were asked to figure out the “maximum heart rate”. Then, we needed to figure out the “Target Rate”; for this step I applied the first formula and multiply it by the percentage given. This step was easy as well. Next step, figure out “Target Achieved”, was a little more difficult to interpret. The formula itself was simple, but I took me a while to understand the question .In this case, I applied my analytical skills. Once, I understood the question, I went over my Scavenger Excel assignment to solve this step. Determining the” Heart Rate Increase” was simple because we were given a hint. We, basically, needed to change the number to percentage. After I finished with the manipulation, I formatted the spreadsheet so when I print it out; it came out in a certain way. I added some headers and footers (to the right and left). I also changed size of the text. Basically, steps mentioned above pertained to the easy section.
The challenging part started with the pivot tables (See figure). In order for me to solve the last steps, I had to watch some videos, which were very helpful. In the past, I had not used pivot table for anything, but I believe this feature of excel could be very useful. Excel and Word are software that I have with for many years, but I have realized that I still don’t know some features of these ones. Doing this project has helped me to become a little more knowledgeable of Excel. During this project, I learned analytical skills that help to interpret the situation or problem very well; problem- solving skills; technical skills which are very useful in business; organizational skills; and computer skills.